
Predictions
Predictions are per-voter probabilities produced by machine-learning models trained on your organization’s own roll, vote history, and knockback data. They are signals, not verdicts — a “likely to turn out” voter is still one who needs a knock, and a “lean R” voter is still one who needs a conversation.
What gets predicted
Section titled “What gets predicted”| Model | Target | Range |
|---|---|---|
| Turnout | Probability this voter casts a ballot in the target election | 0.0 – 1.0 |
| R-ballot | Probability this voter pulls a Republican ballot in the next primary | 0.0 – 1.0 |
| R-lean | Soft score for general-election Republican alignment | 0.0 – 1.0 |
All three are calibrated — a voter at 0.8 should, over a large sample, turn out about 80% of the time. Calibration holds within your organization’s own data; models are never shared between organizations.
Where you see them
Section titled “Where you see them”Predictions surface wherever you target: per-voter probabilities on the voter record, rollups by precinct and by street segment for route batching, and an organization-wide summary with an expected turnout count. The R-Lean view ranks your roll by general-election alignment so you can cut a targeting universe directly from it.
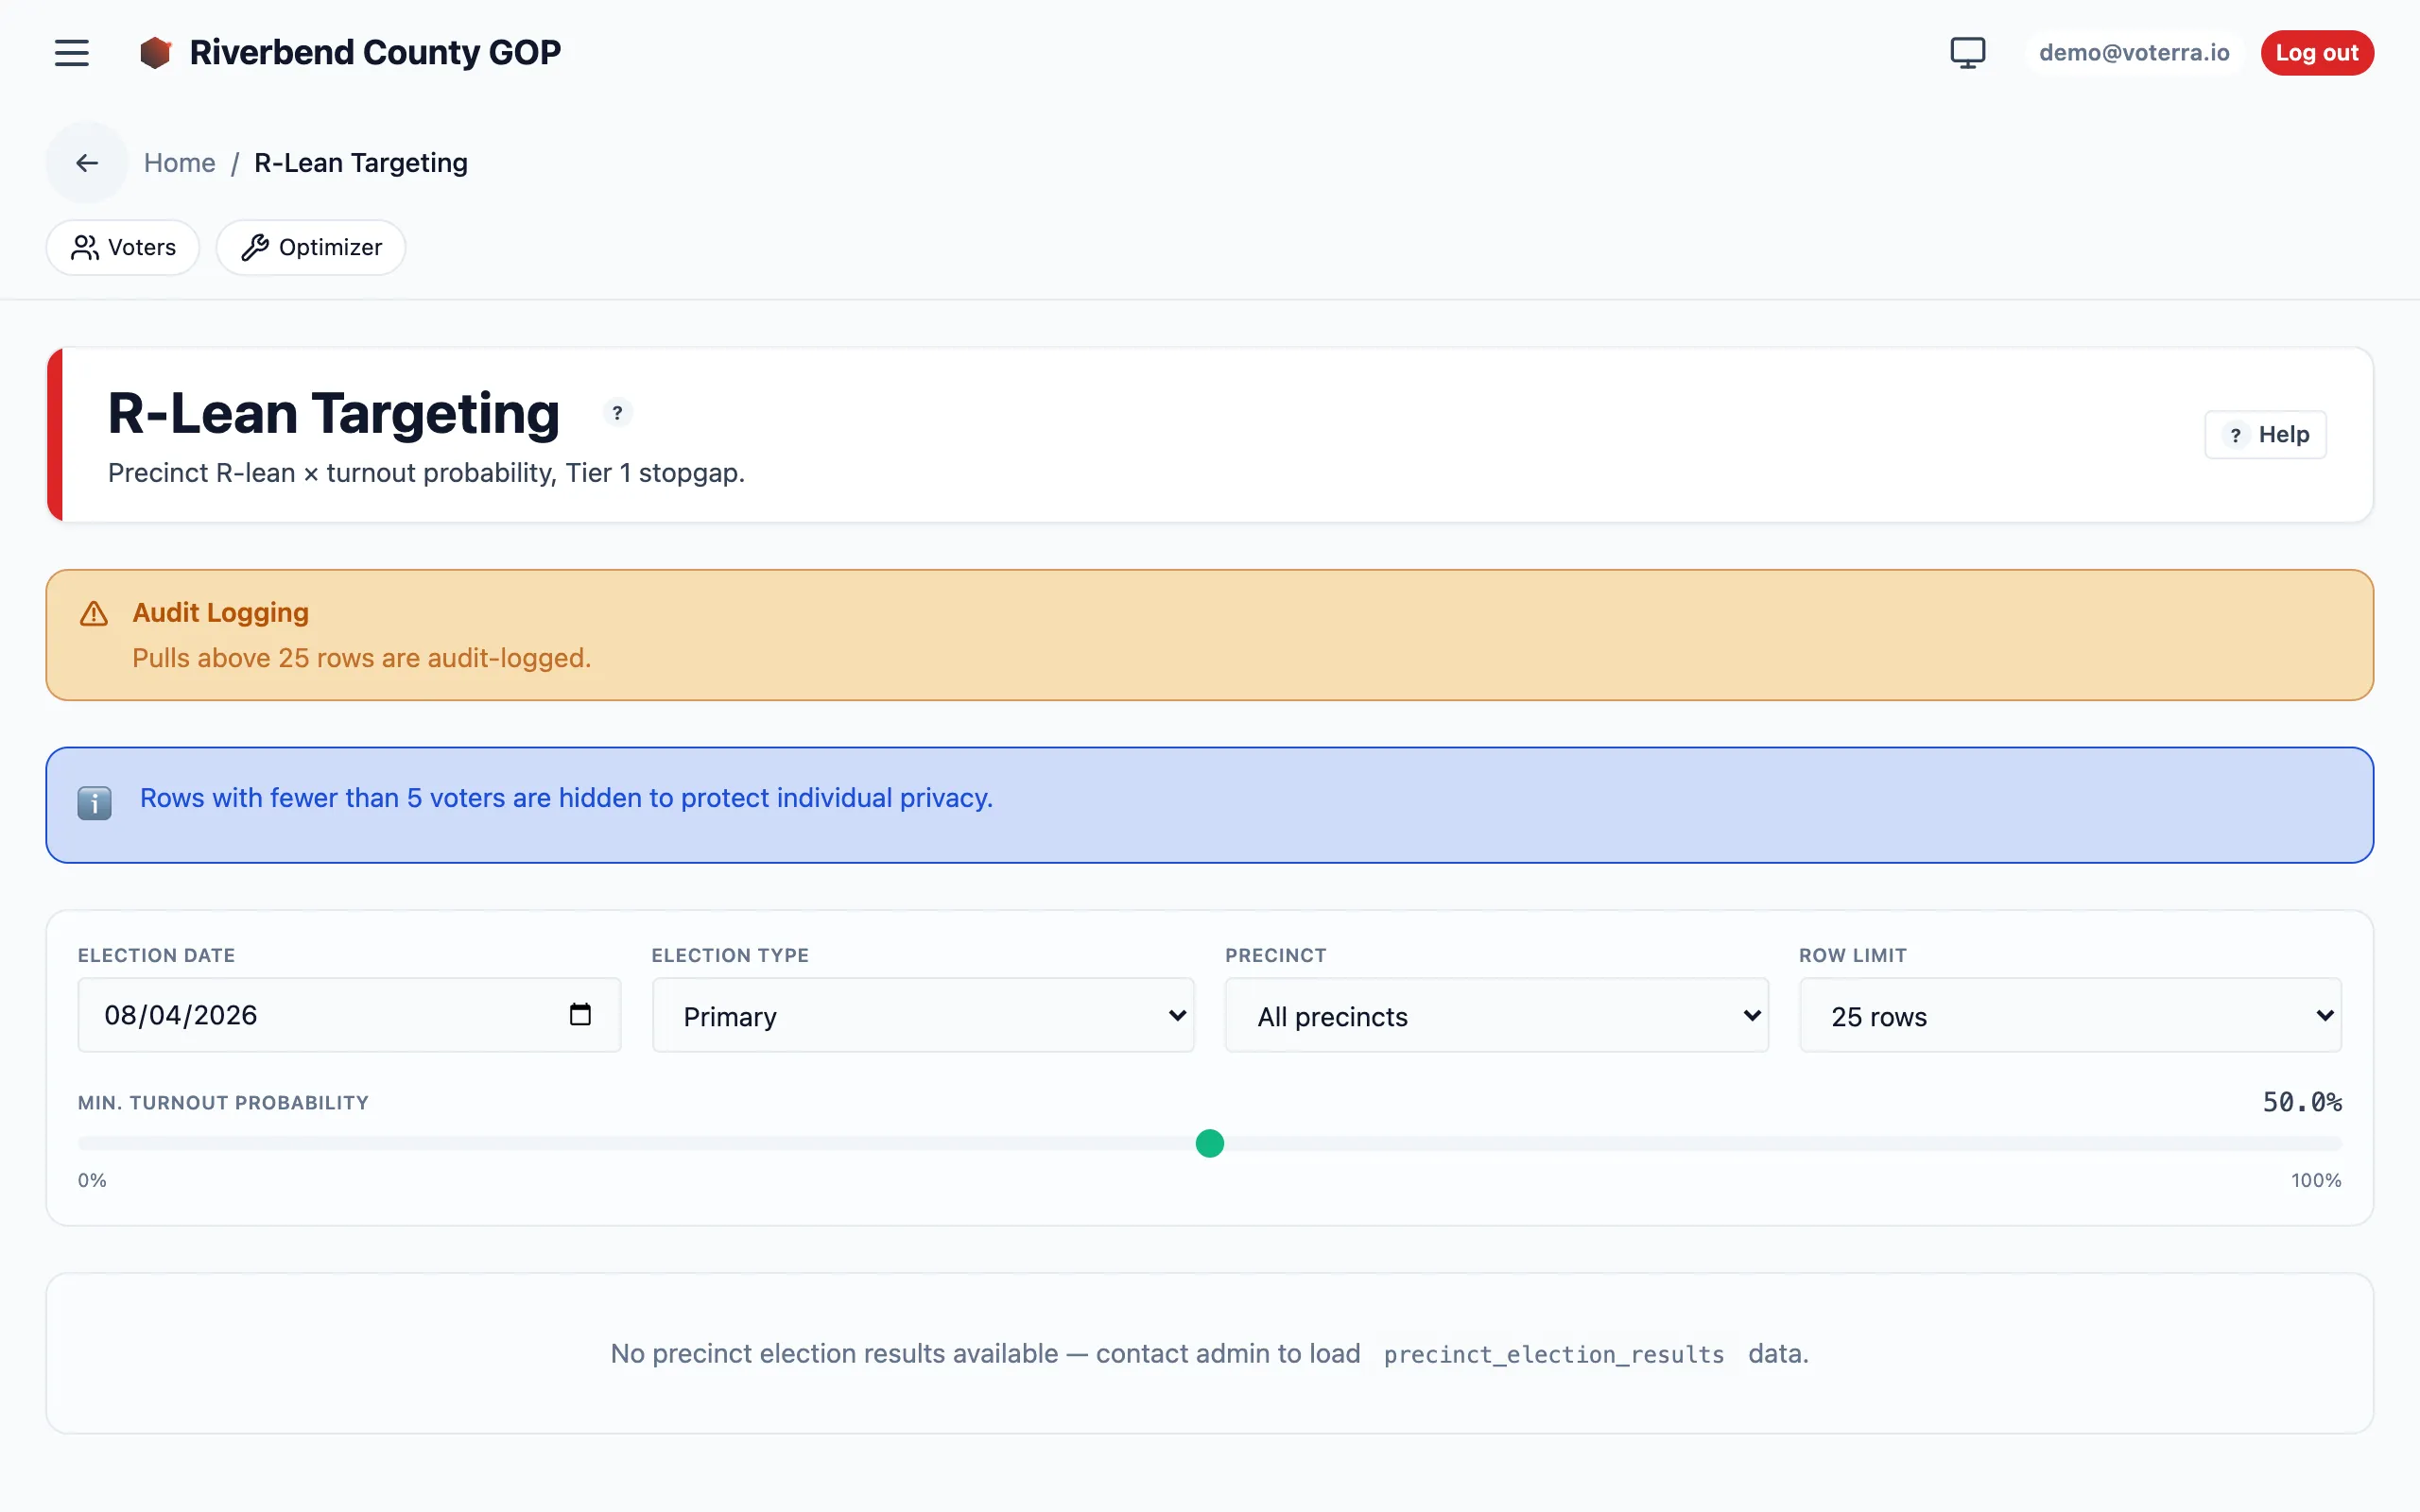
The R-Lean view — your roll ranked by predicted alignment, ready to cut into a targeting universe.
Training cadence
Section titled “Training cadence”- On a fresh import — the turnout model auto-retrains after a roll import that adds a meaningful number of new rows, per organization.
- On demand — a retrain can be run whenever you want a fresh read; ask your Voterra team if you don’t see the option.
- Every cycle — at minimum, retrain after each primary and each general; adding vote history is the single biggest lift to model accuracy.
Every training run records how accurate the model was on held-out data, so “how well is our model doing” always has a concrete, current answer.
These are two different answers, and it’s worth keeping them apart. Held-out accuracy is measured against voters the model didn’t train on, and it is available the moment training finishes. Post-election calibration, in Model Accuracy, is measured against the county’s certified results and is only available after an election. A model can score well on held-out data and still call turnout high across a whole county — the second number is what catches that.
Using predictions in the field
Section titled “Using predictions in the field”Predictions feed route building and universe selection, not door-level decisions:
- Route scoring — the default route builder blends the turnout model’s output with the tier score; a high-scoring, low-turnout voter is still worth a knock, but the walking order may rank them slightly lower.
- Universe cuts — “likely R-ballot, low turnout” is the highest-leverage GOTV universe. Filter to voters with a high R-ballot probability and a low turnout probability, and route the result.
- Post-election debrief — once your county certifies its results and your Voterra team loads them, Model Accuracy compares predicted turnout against the official canvass, jurisdiction by jurisdiction. The gap drives the next retrain and surfaces model drift. You don’t have to wait for the next roll import to find out how you did.